PorcelainLUPI
lieflat charts
Lieflat Charts is an Agent Skills-compatible skill for data visualization, slide decks, and full-page reports. It works with Claude Code, Codex, and other AI agents that support SKILL.md.
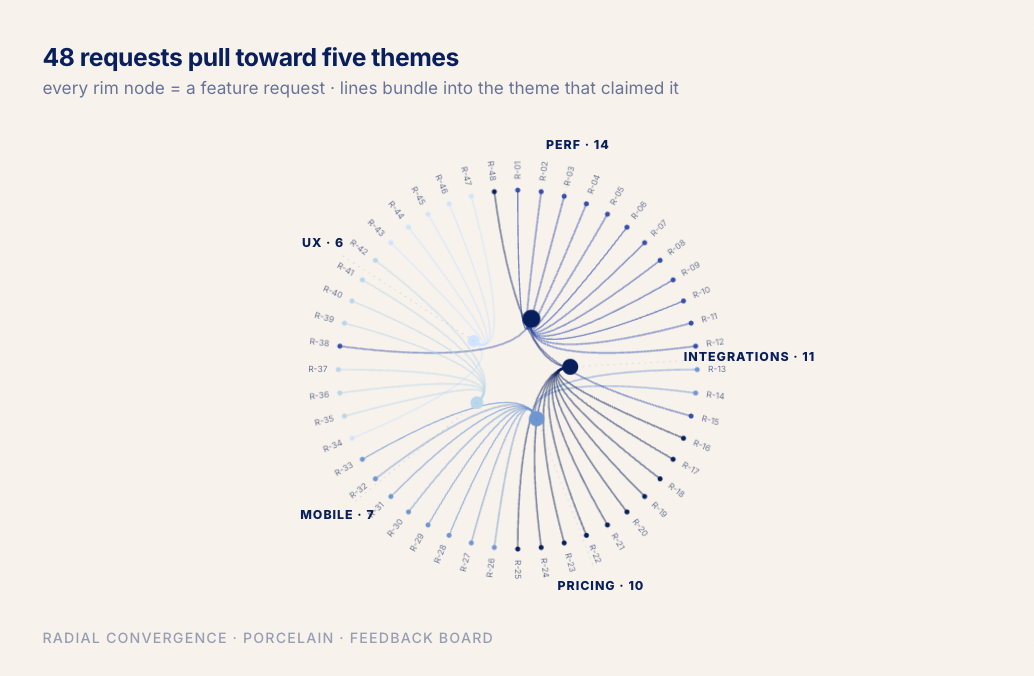
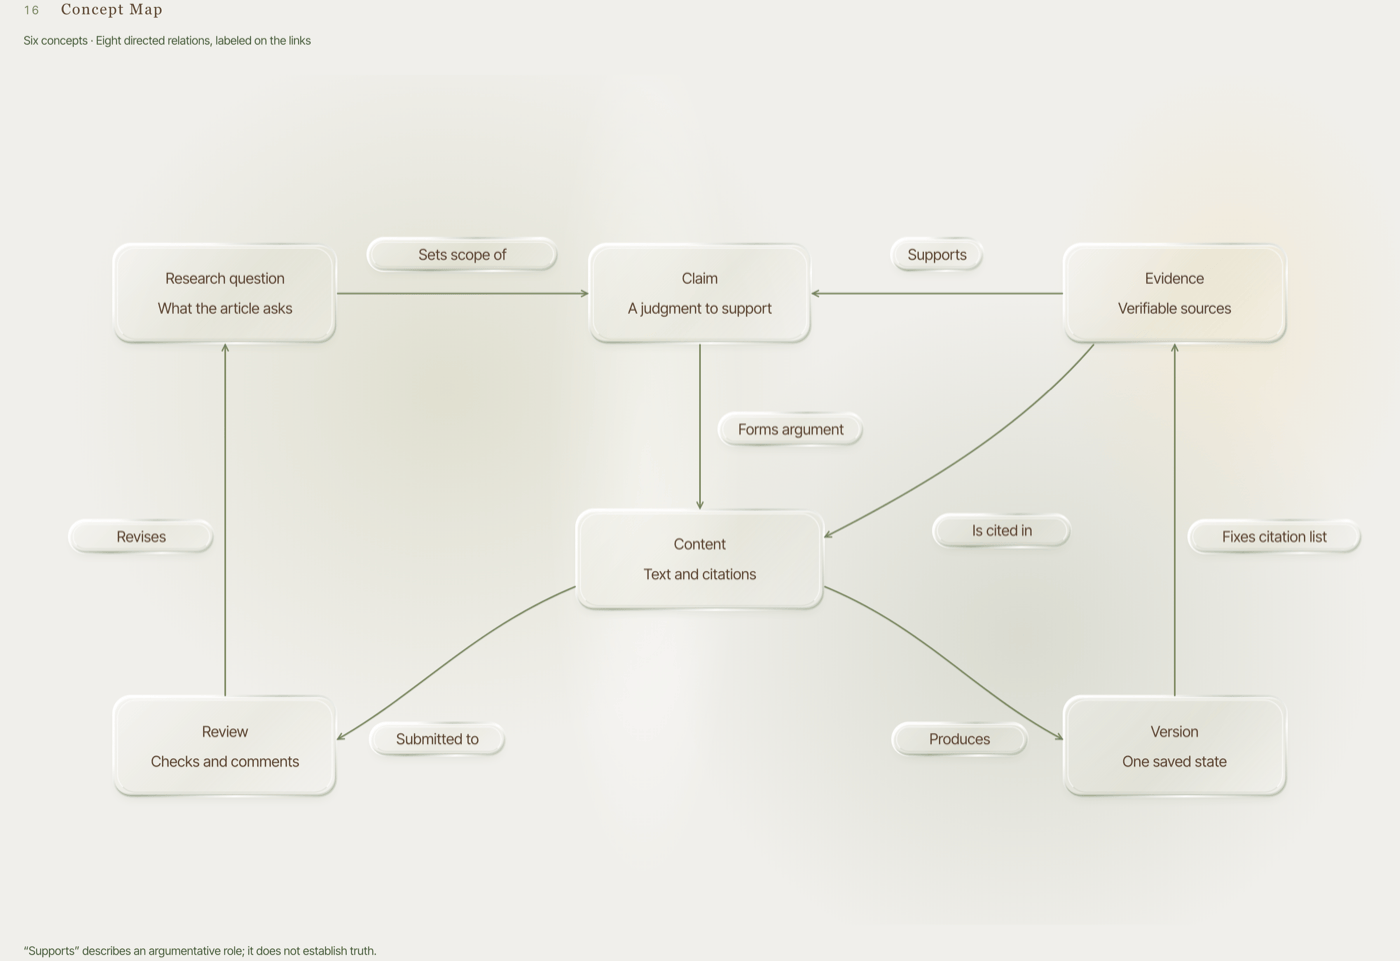
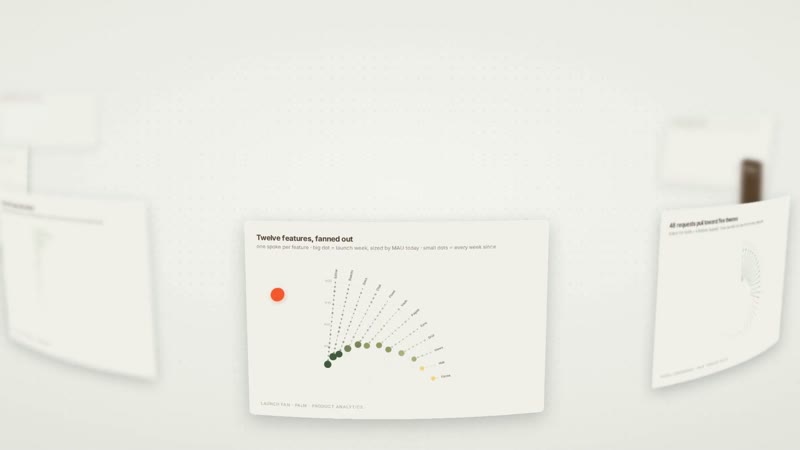
It offers more than 60 chart types, covering everything from simple datasets to complex data. Consistent typography, spacing, line work, and motion form its visual language across three styles: Lupi Editorial, Glance for quick insights, and Lupi Basics.
It can turn your data into beautifully designed charts. For slide decks and reports, the skill also includes built-in HTML templates to generate magazine-style presentations in HTML or PDF, as well as HTML reports, annual reports, monthly reports, white papers, and more.
Lieflat Charts offers four color palettes: minimalist Mono in black, white, and gray, plus Porcelain, Palm, and Wire. The agent selects a palette based on your data structure and context, or builds a custom palette from your brand colors.